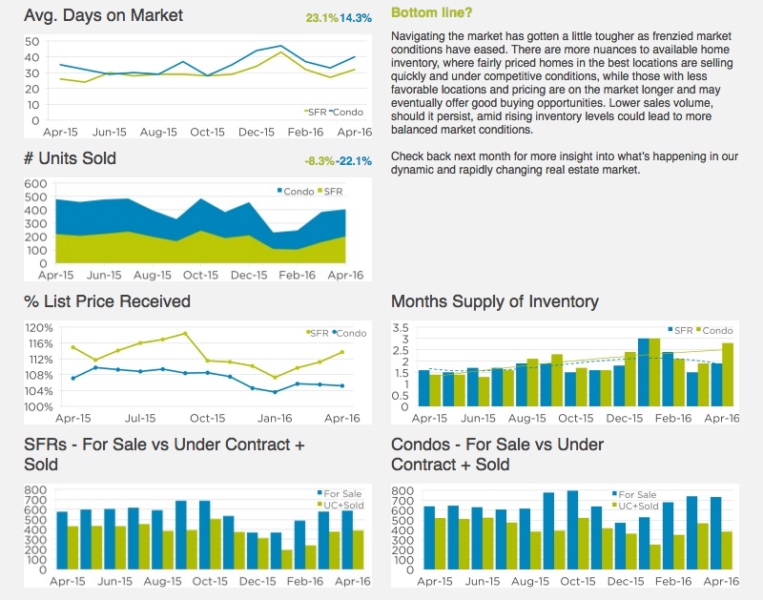
Home sales activity, representing buyer demand, is one of the most basic market trend indicators. We typically compare the same time period because home sales are seasonal, lower in the winter and summer months and higher in the spring and fall. Over the first four months of 2016, the number of homes sold declined by 13% for single family homes and 10% for condominiums versus the same months in 2015. While this does represent lower demand, reviewing other indicators will provide a better understanding of overall market conditions.
The amount of supply available, how long it takes to sell and at what price, will provide a better indication of market dynamics buyers and sellers can expect. On the supply side, the inventory of available homes for sale remains low, but it has increased compared to last year. Single family home inventory was up slightly in April 2016 versus the prior year to 587 homes. Condominium inventory year-over-year was up by 94 units or 15%. In terms of the time required to sell homes placed on the market, the average in 2016 was 35 days, four days longer than in 2015. A selling time under 60 days is considered short and seller favorable, indicating an active market. Finally, the median home price, which represents market conditions motivating a buyer and seller to agree upon a sale price, surpassed or equaled its twelve month high in April 2016.
Median Sales Price |
7.1% |
5.9% |
Patrick’s Properties
239 8th St #7
South of Market
Hip urban loft with large private patio, parking & storage
Listed at $899,000
Open house Monday, May 30th: 1pm-4pm
81 Clairview Ct
Midtown Terrace
Sweet single family home, 3 beds 1 bath
Listed at $895,000
Open house Tuesday, May 31st: 1pm-2:30pm
1350 Natoma St #7
Inner Mission
Newer townhome-style condo. 2 beds 2.5 baths, parking & storage
Listed at $849,000
Showings begin June 11th
 415.971.5651
 patrick@
 SF Office


